Algorithm Friction in Betting Platforms During Peak Traffic Hours
Iris Brooks · Sep 26, 2026
Algorithm Friction in Betting Platforms During Peak Traffic Hours
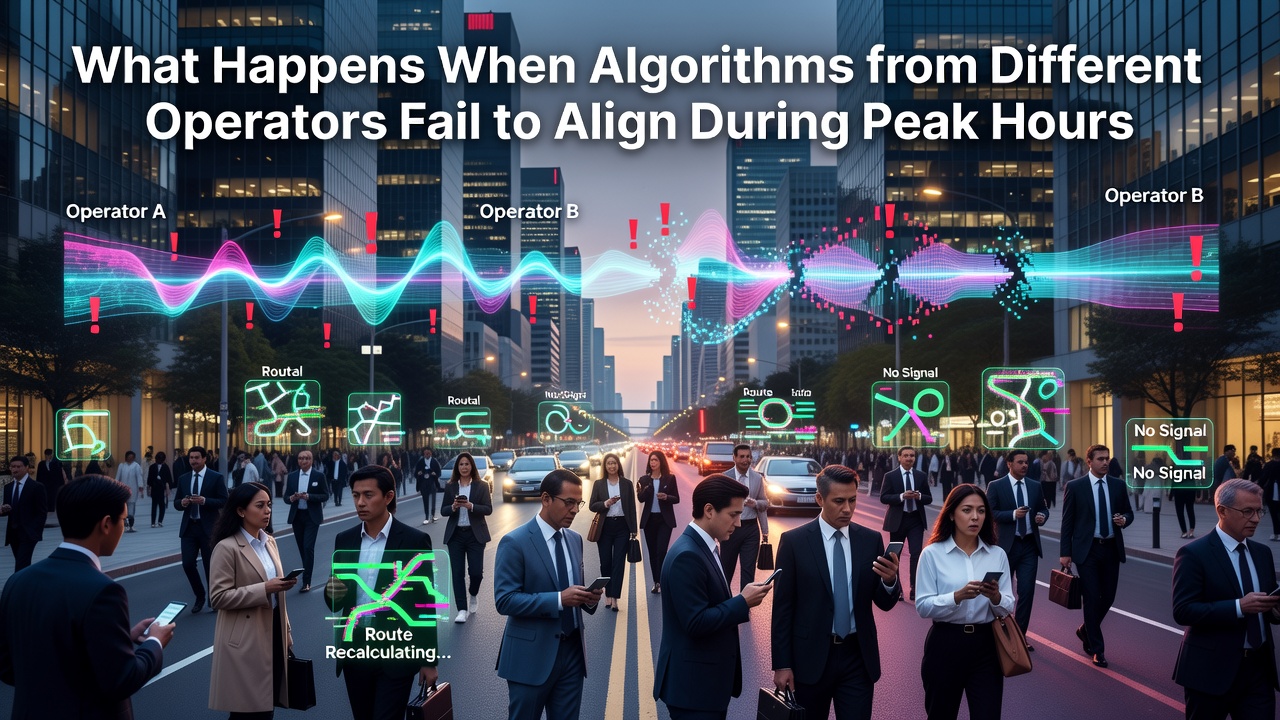
Betting operators rely on proprietary algorithms to adjust odds in real time, yet these systems operate independently across companies and often update at different speeds when demand spikes. During major events in September 2026, traffic volumes push multiple platforms simultaneously, creating windows where one operator's feed reflects fresh data while another's lags by several seconds or minutes. Observers note that such timing gaps produce visible price differences that automated tools can identify and flag for review.
Core Mechanisms Behind the Divergence
Each operator sources data from its own combination of feeds, risk models, and liquidity calculations, so even identical inputs can yield divergent outputs once processed through separate codebases. One platform might incorporate live injury reports within milliseconds while another batches updates every thirty seconds; the result is a temporary mismatch that widens when thousands of users place bets at once. Research from academic institutions shows that latency differences of just 800 milliseconds become statistically significant during peak windows, and industry reports confirm these intervals occur more frequently in high-stakes markets such as football and tennis.
Observable Effects on Live Markets
When algorithms drift out of sync, odds for the same outcome can vary by several percentage points across sites, opening brief arbitrage windows that scanners monitor continuously. Bettors using cross-platform tools sometimes record multiple instances per hour where one bookmaker offers 2.10 on an outcome and another lists 1.95 for the identical selection. Data compiled by European gaming associations indicates that the average duration of such discrepancies shortens as traffic increases, yet the absolute number of detectable gaps rises because more markets experience simultaneous updates. Those monitoring multiple exchanges report that the largest spreads appear in lower-profile leagues where liquidity is thinner and algorithmic refresh rates vary more widely.

Role of Automated Detection Systems
Specialized software aggregates feeds from dozens of operators and applies statistical filters to isolate genuine misalignments from random noise. These systems timestamp each incoming quote, calculate implied probabilities, and alert users when the combined margin across two or more platforms falls below a preset threshold. According to findings published by the Australian Gambling Research Centre, scanner users capture roughly 65 percent of detectable gaps within the first four seconds of their appearance, after which many operators adjust their own models and the edge disappears. The same study notes that platforms employing machine-learning risk engines tend to close gaps faster than those relying on static rule sets, although both approaches can still lag during extreme load.
Broader Market and Regulatory Context
Regulators in multiple jurisdictions track these technical mismatches because rapid price changes can affect consumer protection metrics and market integrity reports. The Nevada Gaming Control Board publishes quarterly summaries that include data on odds volatility during marquee events, providing one benchmark for how often large spreads occur across licensed operators. Industry associations in Canada have begun collaborating with academic researchers to model the relationship between server load and pricing accuracy, aiming to establish voluntary standards for minimum update frequencies. Such initiatives remain separate from direct enforcement yet illustrate growing attention to the technical infrastructure that supports fair pricing.
Practical Implications for Platform Operators
Operators respond to recurring misalignments by investing in faster data pipelines and redundant risk engines that activate during anticipated surges. Some firms now run parallel shadow algorithms that compare outputs in real time and trigger manual overrides when divergence exceeds preset tolerances. Figures released by the European Betting and Gaming Association reveal that companies adopting these layered approaches reduced average gap duration by 22 percent during the 2026 summer football tournaments compared with the previous season. The same data set shows that smaller operators without equivalent infrastructure experienced longer windows of misalignment, resulting in higher volumes of arbitrage activity directed toward their books.
Conclusion
Algorithm misalignment during peak hours stems from independent processing speeds, varied data sources, and differing risk tolerances across betting operators. The resulting price discrepancies create measurable opportunities that detection tools identify and exploit within seconds. Regulatory bodies and industry groups continue to monitor these patterns through published reports and collaborative research, while operators implement technical upgrades to narrow the intervals. As event calendars remain packed through late 2026, the frequency and duration of such gaps will continue to reflect the underlying synchronization capabilities of each platform's algorithmic stack.